


We will now discuss the current status of fat intake by Japanese people in relation to the target consumption amounts in Table 2. Tables 3-1 and 3-2 show data of fiscal 2023 (overview of results) from the National Health and Nutrition Survey that is conducted annually by the MHLW. When looking at the energy ratio from fat consumption, the actual amount consumed by Japanese men is largely in the range of target amounts defined by dietary standards. However, a slightly excessive amount is consumed by women aged 15 to 29 years. Also, men in all age groups consume more animal fats than plant fats. Women consume an increasing amount of animal fats as they increase in age. However, these are only averages; there are some individuals who consume far too much fat or far too little fat. It should be noted that the levels defined as preferable are not necessarily appropriate for all people.
Table 3-1: Amount of fat consumed by age group (men)
| Age group | Total energy consumed(Kcal) | Fat consumption amount(g) | Energy ratio(%)for fat consumption | Animal fat(g) | Ratio of plant fats In fats(%) |
|---|---|---|---|---|---|
| Overall average | 2,081 | 66.0 | 28.2 | 43.7 | 34 |
| 1 to 6 years | 1,260 | 40.0 | 27.4 | 27.1 | 32 |
| 7 to 14 years | 2,011 | 67.9 | 30.1 | 44.0 | 35 |
| 15 to 19 years | 2,557 | 64.8 | 29.2 | 57.0 | 12 |
| 20 to 29 years | 2,088 | 70.3 | 29.7 | 45.8 | 35 |
| 30 to 39 years | 2,104 | 69.5 | 29.6 | 46.3 | 33 |
| 40 to 49 years | 2,154 | 69.9 | 28.9 | 45.2 | 35 |
| 50 to 59 years | 2,107 | 67.2 | 28.2 | 44.3 | 34 |
| 60 to 69 years | 2,197 | 67.0 | 27.2 | 44.5 | 34 |
| 70 to 79 years | 2,105 | 64.9 | 27.6 | 43.2 | 33 |
| 80 years and older | 1,296 | 55.2 | 25.6 | 38.4 | 30 |
Table 3-2: Amount of fat consumed by age group (women)
| Age group | Total energy consumed(Kcal) | Fat consumption amount(g) | Energy ratio(%)for fat consumption | Animal fat(g) | Ratio of plant fats In fats(%) |
|---|---|---|---|---|---|
| Overall average | 1,685 | 56.3 | 29.5 | 29.0 | 48 |
| 1 to 6 years | 1,193 | 38.6 | 27.9 | 21.5 | 44 |
| 7 to 14 years | 1,799 | 60.8 | 30.2 | 35.8 | 41 |
| 15 to 19 years | 1,770 | 61.7 | 31.4 | 32.4 | 47 |
| 20 to 29 years | 1,630 | 59.0 | 32.0 | 32.2 | 45 |
| 30 to 39 years | 1,661 | 56.0 | 29.8 | 28.6 | 49 |
| 40 to 49 years | 1,701 | 58.2 | 30.3 | 30.0 | 48 |
| 50 to 59 years | 1,728 | 58.8 | 30.2 | 29.8 | 49 |
| 60 to 69 years | 1,736 | 58.8 | 30.2 | 29.2 | 50 |
| 70 to 79 years | 1,729 | 54.9 | 28.3 | 27.3 | 50 |
| 80 years and older | 1,651 | 48.8 | 26.2 | 24.2 | 50 |
Source: Overview of results for National Health and Nutrition Survey (MHLW) (FY2023)
Fats are contained in almost all food products. Figure 1 shows an estimate of the foods from which fats are consumed according to the According to the National Health and Nutrition Survey (MHLW). The majority of fats are obtained from meat, followed by vegetable oil. About 20% of daily fat consumption comes from vegetable oil, butter, margarine, and other food products which are obviously fats (oils), while the remaining 80% come from other food products. This 80% is referred to as "invisible fat." This "invisible fat" must be included when managing fat consumption. However, realistically speaking, it is difficult to calculate the amount of fat contained in all food products and to manage consumption (invisible fat will be discussed later).
Figure 1: Ration of fat consumption by food product group (average per person per day)
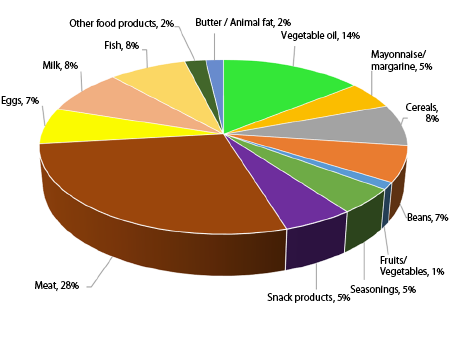
Source: National Health and Nutrition Survey (MHLW) (FY2019)
Note: Calculated by the JOPA based on food products consumed on average on a daily basis according to the National Health and Nutrition Survey